Tools for visualizing an options payoff
See how a multi-leg options structure behaves across price, time, and volatility before you place it.
This job is about seeing the shape of a trade, not picking a winner.
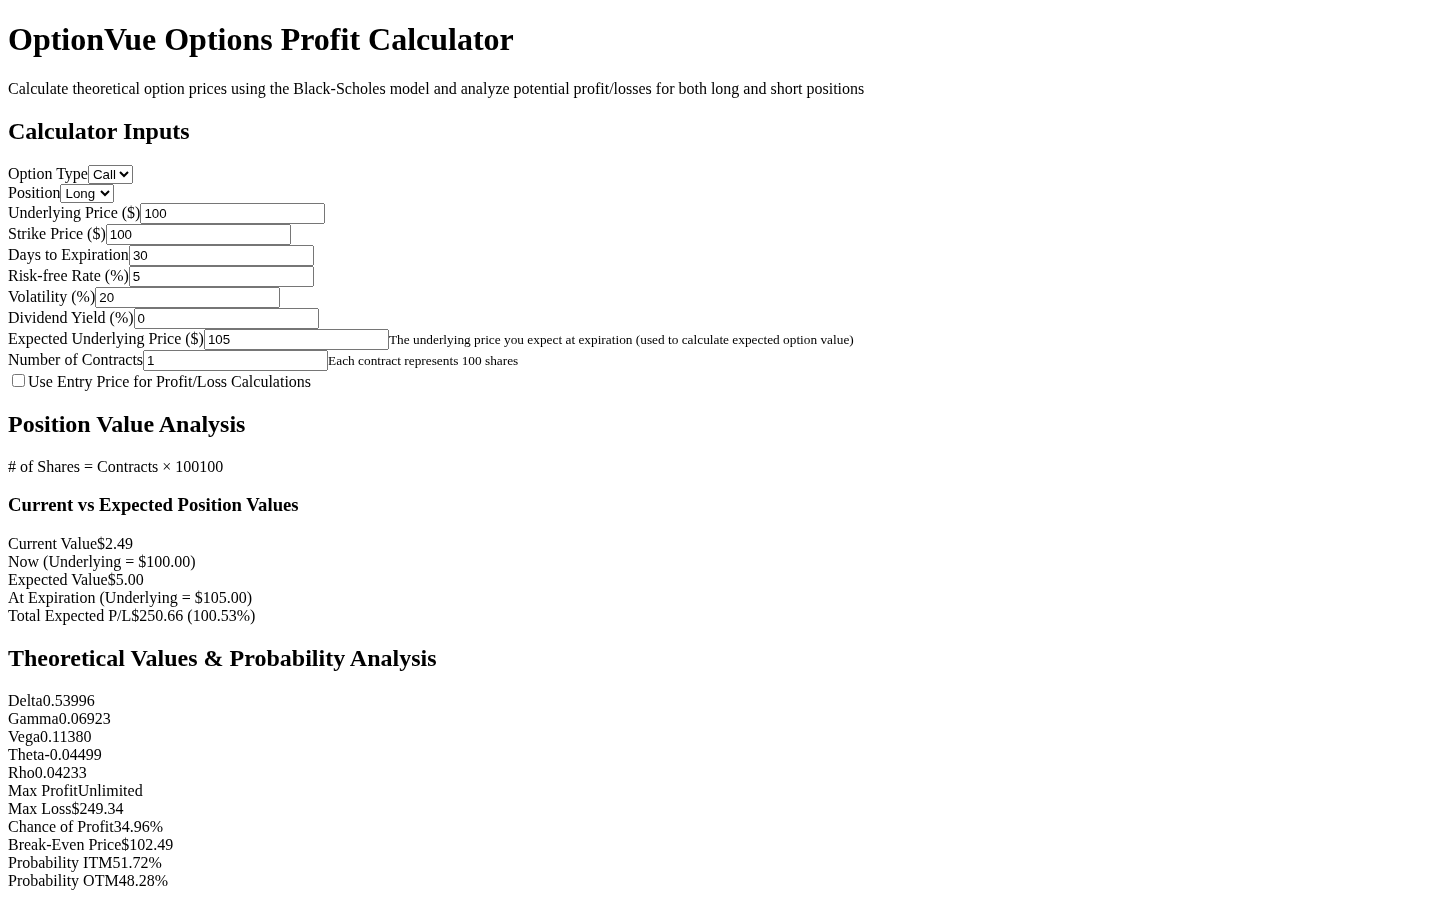
A payoff visualizer (sometimes called an options profit calculator or strategy builder) lets you assemble calls, puts, and sometimes stock, then plot estimated profit and loss across a range of underlying prices. Useful outputs include debit or credit, listed maximum gain and loss where those are defined, breakeven prices, and how the picture changes if you move a strike, change expiration, or change implied volatility.
It does not tell you whether the trade will make money. It does not replace a broker ticket. It does not prove a strategy is good.
Use this job when you already have a structure in mind — a long call, a vertical, an iron condor, a calendar — and you want to understand the diagram before you send an order somewhere else.
Canadian readers: most public payoff tools are built around US-listed options. Coverage of Montréal Exchange or other Canadian-listed options is unverified for each tool unless the review says otherwise.
Software listed for this job
Order follows the catalog. A listing is a job match, not a ranking.